How to Become a Google Analytics Super Sleuth
Monday, September 12, 2016
Marketing
How to Become a Google Analytics Super Sleuth
I have a special love-hate relationship with Google Analytics. On the good side, there is so much data. On the bad side, there is so much data. It can be overwhelming. But it can also be magical when you dig through the data and find that “aha!”
Setting up Google Analytics – the Basics
You need to have the proper pieces set in place before you begin your analytics journey.
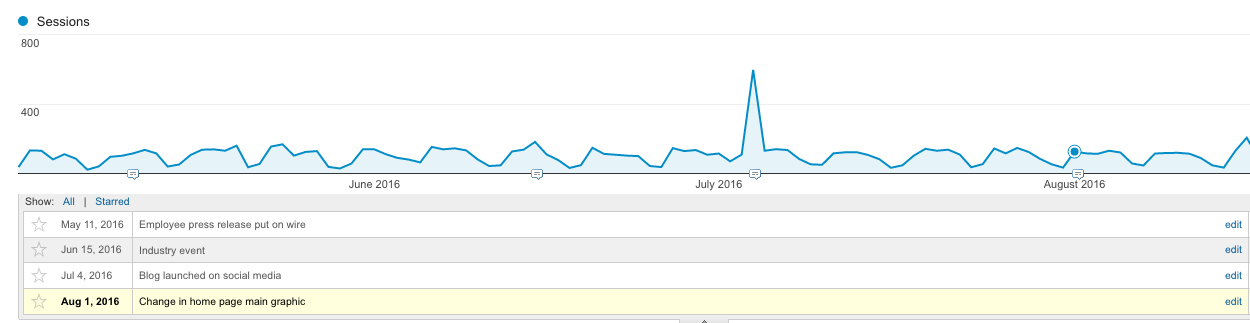
- Annotate key milestones of the website or your business that could affect website traffic (e.g., banner ads launched, home page promo replaced, etc.). These can be really helpful when looking back and wondering why there was a shift in certain metrics.
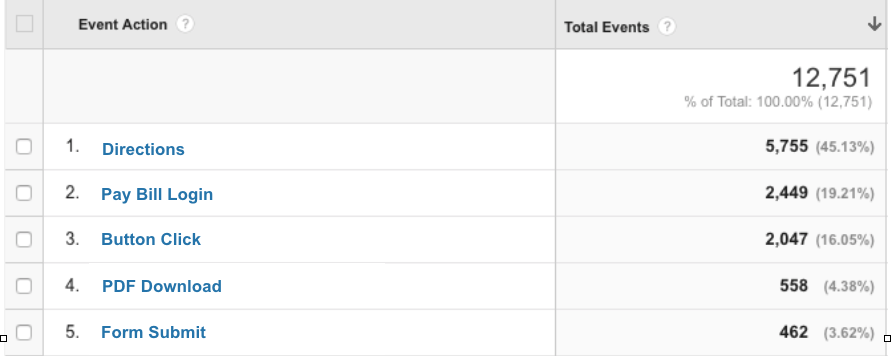
- Set up specific events tied to your business goals. For example, if business leads are important, track your “contact us” form submissions. If there is a recruitment initiative, track the “apply now” button clicks. (Note: There is a bit of coding involved with tracking events, so you may want to work with your development team.)
- Turn on all the elements under “Audience” (e.g., Demographics, Geography, Interests).
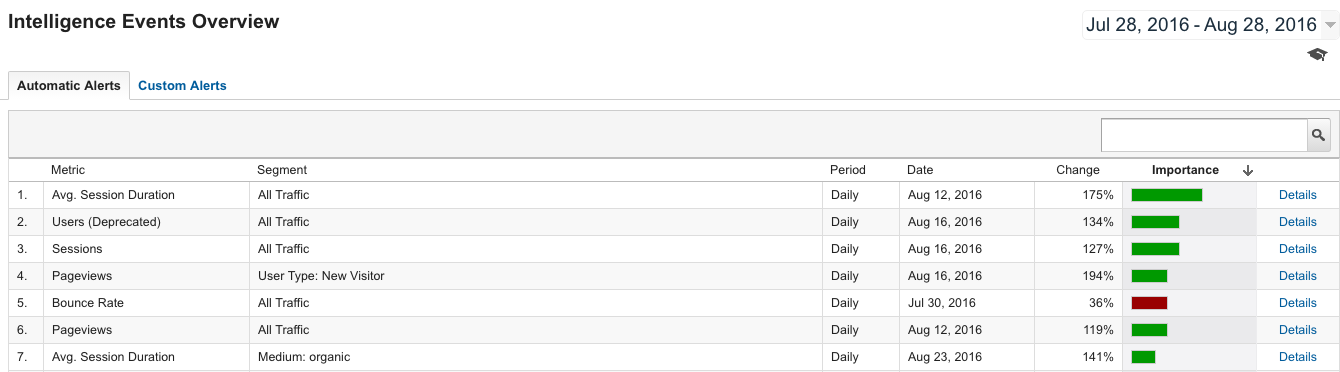
- Use the Intelligence Events Overview if you’re looking to do a brief check; it can be extremely helpful in quickly identifying anomalies.
Your go-to analytics may vary based on your business goals, but in most cases some of your key metrics will include sessions, pages per session, time on site/page, bounce rate, pages visited and acquisition overview.
Becoming an Analytics Super Sleuth
Now you know the key metrics to monitor. But when these key metrics are down or off, that’s when you put on your detective hat to solve the “why?” and figure out how to fix it.
Here are some real examples of the art of Google Analytics sleuthing from both our clients and our own Balcom website.
- Traffic. If your traffic is down, look in Acquisition to see which traffic channel is down. For instance, if referral traffic has decreased, possibly a big partner removed your website link from their website.
- Time on home page. Dig into the “why?” before reacting. After one home page redesign we did for a client, time spent on the home page significantly decreased. The client was greatly alarmed and wanted to change it back. But when we dug a bit deeper, we discovered the time on the other key pages (e.g., blogs) had significantly increased, which meant people were just finding what they needed more quickly – which is a good thing.
- Organic search. Be sure to use the newly launched Search Console. It tells you which pages are providing the most organic search impressions. We recently discovered that a blog from over a year ago is drawing the most organic website traffic. This tells us the information in that blog is very beneficial to our target audience, and we recommended creating more blogs on that same topic.
So yes, there are standard metrics we pull for monthly reports. But the key is interpreting them in the right way and providing recommendations based on your business and goals.
Need help interpreting your website data? Put the B Team on the case.
Tags: Web & Digital